Narrative review · Worked example & template
Narrative review synthesis matrix: a worked clinical example
INRA.AI Team ·
Download the Excel templateThree trials can study remote care for heart failure and still give you three different things to compare: whether a patient is readmitted, whether they are readmitted or die, and how much time is lost to hospital admission or death. Calling all three outcomes "readmissions" would make the review easier to write and less accurate.
A synthesis matrix puts those differences where you can see them. It is a table of source notes, study characteristics and relationships that helps you build a discussion around a question rather than a sequence of papers.
Below, we work through three real trials, then turn the comparison into a paragraph and an outline. You can follow along in the Excel template, which includes the completed example and a blank sheet.
Start with the question, then choose the fields
For this example, the working question is: What do selected trials tell us about remote care, hospital use and death in adults with heart failure?
Johns Hopkins' library guidance describes using a matrix to organise relationships among sources. Columbia's health sciences library also recommends recording study characteristics and limitations. Choose the fields to fit your question.
Give each source note a column. Start with its citation and passage locator, population, intervention, comparator, outcome, timeframe and result. Keep the reported effect estimate and uncertainty with the result; "positive" or "negative" is too little to work with. Add a limitation and your proposed relationship to other sources.
The workbook has extra fields for version, note type and unresolved questions. Use what your review needs. For a qualitative paper, for example, a phenomenon or experience may belong where a trial has an intervention or outcome.
Label quotations, paraphrases and your interpretations separately. "Not checked" means you still have work to do; "not reported" means you looked for the detail and did not find it in the material checked. Neither means zero.
Worked example: three heart-failure trials
These trials were selected to illustrate comparison, not to represent all evidence on remote heart-failure care. This is a writing example, not a current treatment recommendation or a completed systematic review.
All three were randomised trials, but their populations and care models differed:
- Tele-HF, Chaudhry et al. (2010), enrolled 1,653 patients recently hospitalised for heart failure. Patients in the intervention group used an automated telephone system to report symptoms and weight for clinician review.
- BEAT-HF, Ong et al. (2016), enrolled 1,437 patients aged 50 or older at six California medical centres. It combined remote monitoring with telephone coaching after discharge.
- TIM-HF2, Koehler et al. (2018), tested structured remote patient management in Germany. Eligibility included New York Heart Association (NYHA) class II or III heart failure and a heart-failure admission in the preceding year; major depression was an exclusion. Of 1,571 randomised patients, 1,538 entered the full analysis set. The primary paper is also available in a public dossier, on PDF pages 103 to 113.
Each intervention was compared with usual care in its own trial. That does not make the care models, populations or usual-care arrangements identical.
Record the endpoint before the headline result
| Trial | Primary outcome and timing | Reported comparison |
|---|---|---|
| Tele-HF | Readmission for any reason or death from any cause within 180 days of enrolment | 52.3% with telemonitoring vs 51.5% with usual care; difference 0.8 percentage points, 95% CI -4.0 to 5.6 |
| BEAT-HF | Readmission for any reason within 180 days of discharge | 50.8% with the intervention vs 49.2% with usual care; adjusted hazard ratio 1.03, 95% CI 0.88 to 1.20 |
| TIM-HF2 | Percentage of days lost to unplanned cardiovascular admission or death from any cause over about 12 months | 4.88% with remote management vs 6.64% with usual care; reported ratio 0.80, 95% CI 0.65 to 1.00; p=0.0460 |
Figures are reported by the trials, not recalculated or pooled here. TIM-HF2's published confidence interval rounds to 1.00 at its upper limit; its reported p value is retained rather than changing either figure. The workbook identifies the source sections and analysis used.
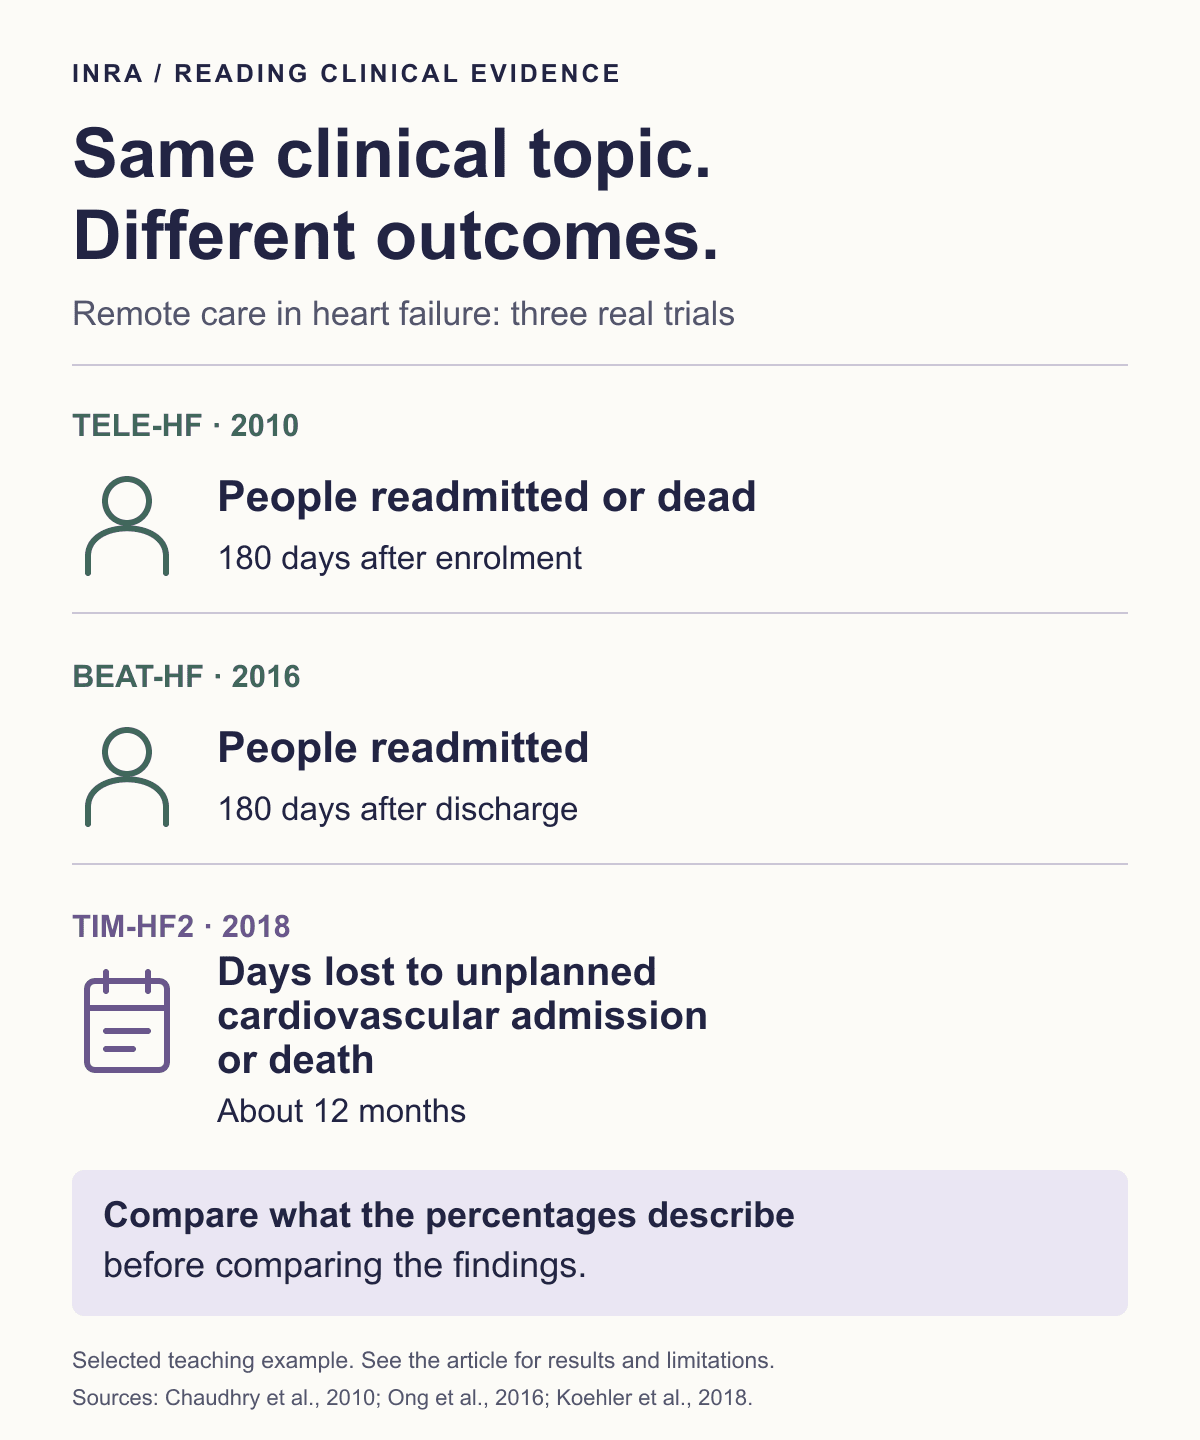
Tele-HF's primary outcome includes death; BEAT-HF's does not. TIM-HF2 counts a proportion of time, rather than simply the proportion of patients with an event. Its 4.88% therefore cannot be read as a readmission rate alongside BEAT-HF's 50.8%.
The estimates also have different meanings: a percentage-point difference, a hazard ratio and the ratio reported for a days-lost endpoint are not interchangeable. The first two trials did not demonstrate a benefit on their primary outcomes. That is not proof that every form of remote care has no effect.
Make the relationship explicit
A weak summary would be: "Two trials found telemonitoring ineffective, but a third proved that it works."
That sentence counts verdicts and loses the question each trial tested. It also invites an explanation the comparison cannot establish, such as assuming that one feature of TIM-HF2 caused its different result.
A more defensible paragraph is:
In these selected trials, Tele-HF and BEAT-HF did not demonstrate improvements in their respective 180-day primary outcomes. TIM-HF2 reported fewer days lost to unplanned cardiovascular admission or death with structured remote patient management. However, its endpoint, eligible population and intervention differed from those in the other trials. This comparison does not establish which differences account for the findings.
This is our synthesis of the three reports, not a quotation from a study. Read it alongside the estimates above. A full review would also need a justified search and selection approach, critical appraisal and the rest of the relevant evidence.
In the matrix, the relationship could be recorded as "shared clinical topic; different primary endpoints and care models." The unresolved question is which differences might explain the findings. These trials did not randomise patients between one another's programmes, so the matrix cannot supply that answer.
Let the comparison change the outline
An outline headed "Tele-HF", "BEAT-HF" and "TIM-HF2" would reproduce the order of your reading. For this question, more useful headings would be:
- What remote care involved and who received it. Compare the intervention, usual care and eligibility criteria.
- What counted as a hospital-use outcome. Separate readmission, the composite of readmission or death, and days lost.
- What the findings leave unresolved. Discuss the estimates, study limitations and limits of comparison.
Under each heading, compare the relevant evidence across studies. Keep study IDs attached to the notes so a co-author can trace each clause back to its source. If a source does not address a section's question, leave it out of that section rather than forcing every paper into every theme.
The matrix will not assess risk of bias for you. Nor will filling every cell make a search complete. SANRA concerns the quality of narrative-review articles; it does not validate this template or replace appraisal of the included studies.
Use it on your next section
Download the synthesis matrix. The blank sheet and real-trial example are editable, with no INRA account required.
Choose a small set of papers you have already read. Fill the source and result fields, then write one relationship in your own words. Draft a heading and a paragraph from that comparison. Check whether each clause still means what the cited passage supports.
If the comparison exposes a missing source, our academic search guide can help you plan the next search. Use the citation accuracy guide when checking the paragraph against the papers.